
R&D Technology
One of the major challenges in proteomics is the accurate display of the peptides and proteins of body fluids, providing an opportunity to get a fast and authentic description of the individual health of an organism. Measurement of the proteome in combination with on-line database matching is the key to an all-in-one diagnosis for a wide spectrum of clinical applications.
We developed a unique technology to examine minute amounts of biological fluids like dialysate, urine, serum, liquor etc. by capillary electrophoresis (CE) connected to mass-spectroscopy (MS). This fast technology (less than 60 min per run) is capable to display > 1000 polypeptides in a single CE-MS run without the need for specific reagents. Separation time and mass to charge ratio are used to get a pattern of peptides and proteins. This pattern is used in a database to identify disease markers. After crosschecking a polypeptide pattern from a patient against our database we see a clear-cut mosaic-picture that enables an unsurpassed diagnosis with yet unknown precision. This pattern allows not only diagnosis of a developing disease at an early stage, but also evaluation of the therapeutic strategy and the therapeutic benefit and/or side-effects of drugs.
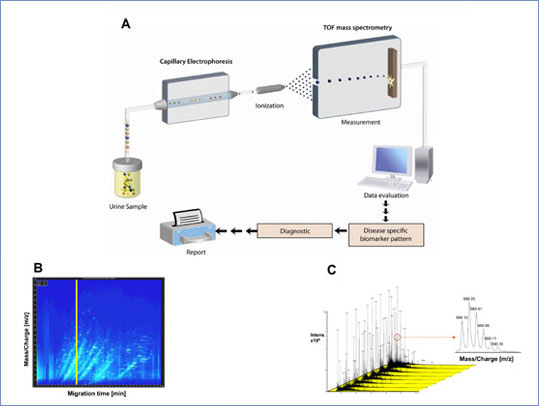
Figure 1: (A) After electrophoretic separation, the polypeptides are ionized by the application of high voltage and analyzed in the mass spectrometer (ESI-TOF). The combination of the two instruments yields a mass spectrogram of mass per charge plotted against migration time. (B) Contour plot of a typical CE-MS run. m/z is plotted against the migration time, the signal intensity is colour coded. (C) Eight consecutive single spectra, which were analyzed in 0.5 minutes (the position is indicated by the vertical yellow bar in panel B) are shown to reveal the high amount of information contained in CE-MS analysis. The resolution of the mass spectrometer is illustrated in a magnified view of one of the polypeptide signals shown in the lower right panel.
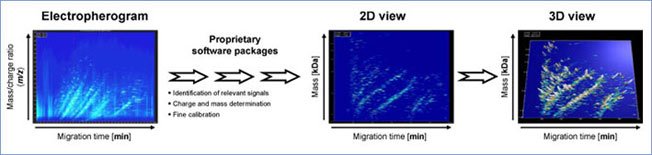
Figure 2: Specialized software solution allows automated data interpretation. Electropherogram as a two-dimensional contour plot, mass per charge on the Y-axis against the migration time in min (X-axis), signal intensity is color-coded. Signals that fit the criteria of "real polypeptide" signals are considered. Charge is assigned to each of these signals, conjugated peaks are combined, and as a result a spectrum based on mass and normalized migration time is obtained. The software enables the compilation of individual data sets to disease specific polypeptide patterns and the depiction of spectra in a 2D and 3D view.
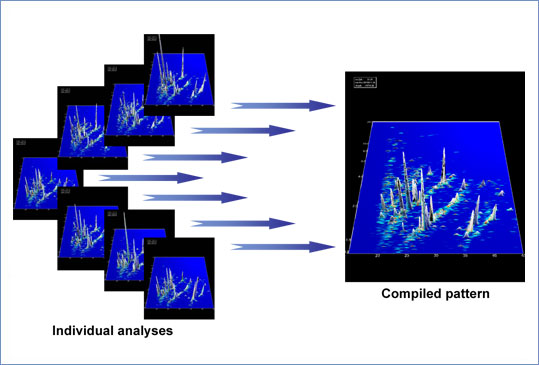
Figure 3: Digital data compilation. Individual datasets from CE-MS analysis of human urine samples were calibrated using internal standards. The left panel displays these data in a 3-dimensional contour plot: mass (in kDa on a logarithmic scale) plotted against normalized migration time (min). The MS signal intensity is represented by the peak height as well as color. The data were digitally compiled to a group-specific polypeptide pattern, shown in the right panel.
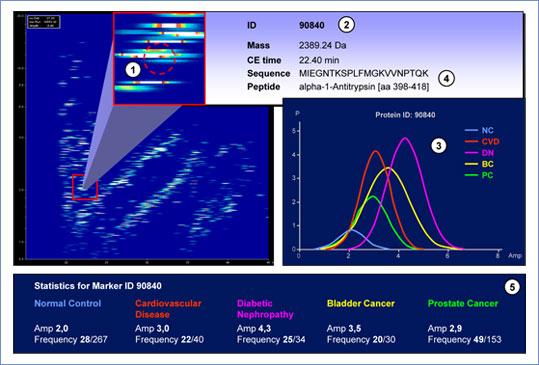
Figure 4: Urinary proteome map. For each CE-MS-defined polypeptide (1) of a given pattern with mass plotted against CE migration time, the biomarker-defining parameters (mass, CE migration time, protein ID (2), determined polypeptide sequence (4), and fragment information) can be displayed. In addition, the amplitude distribution (3) of the biomarker presuming a Gaussian distribution and statistical data available for selected specific diseases are shown (5).