
Chronic kidney disease
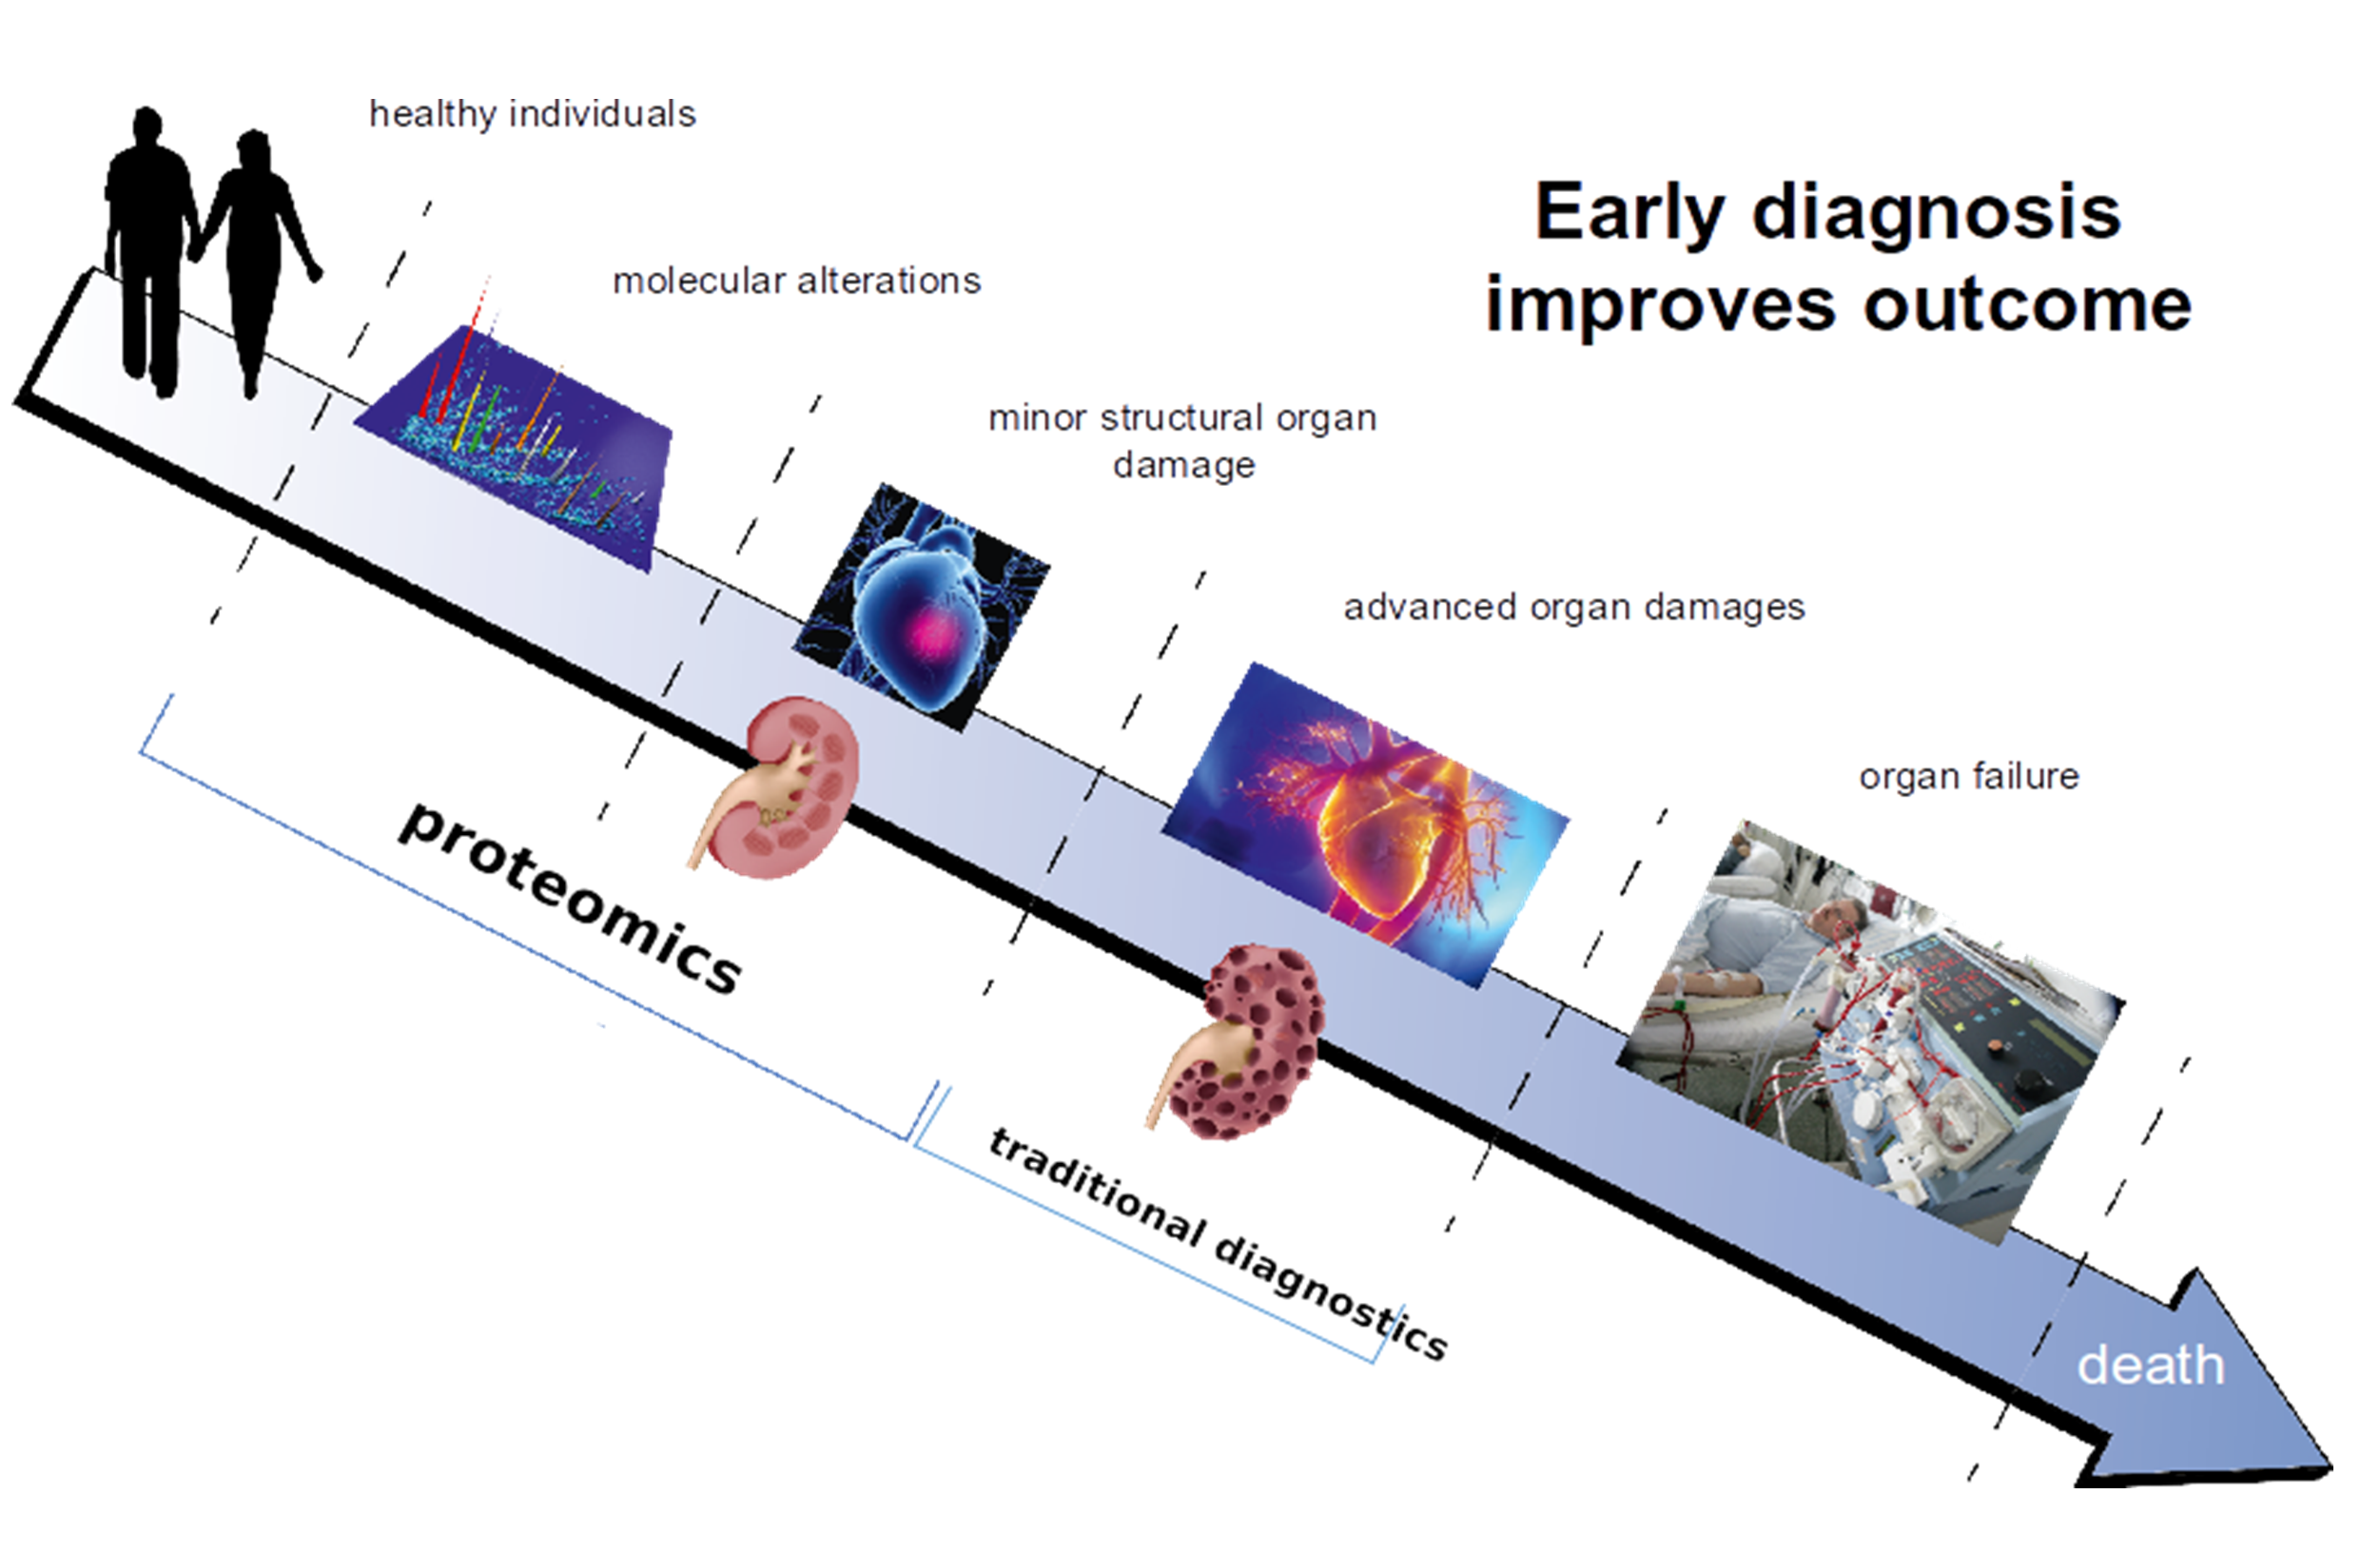
Proteins are responsible for structure and signalling in living organisms and in every organ. Based on this consideration, it appears only logical investigate proteomic changes in the context of chronic kidney disease (CKD), aiming at identifying molecular changes associated with CKD onset and progression that can be linked to molecular pathophysiology and that could serve as more appropriate biomarkers or even as therapeutic targets. Figure 1 illustrates this concept of how early diagnosis and/or prognosis of diseases, based on proteomic changes involved in pathology, improves chances for better outcomes for patients.
Diagnosis and Prognosis of CKD
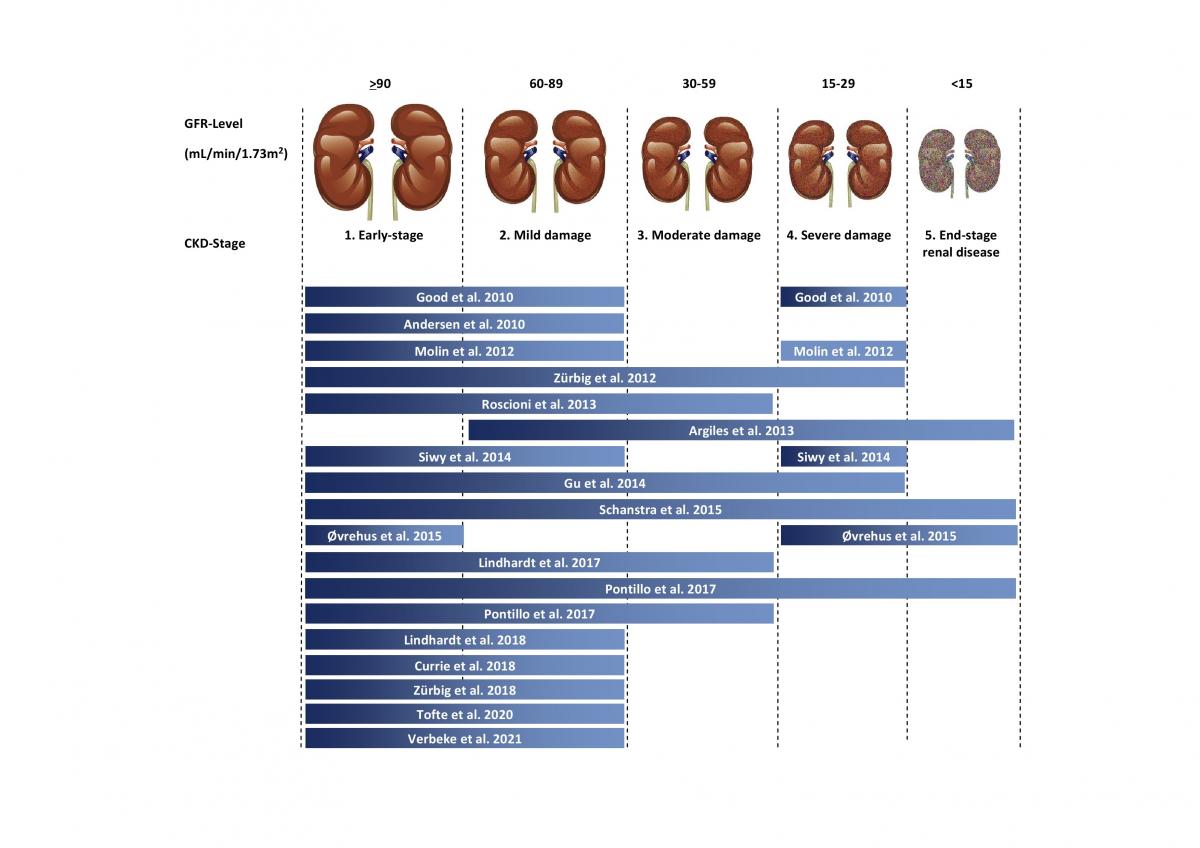
The urinary peptides-based classifier CKD273 is a general classifier for the diagnosis of all CKD types. It was developed in 2010 by Good et al. 1. The rational was to identify biomarkers associated with CKD in general and enable the early detection of molecular changes that predict the development or progression of CKD. In the above study, 273 urinary peptides were identified that significantly differed between CKD and healthy controls. The first validation of the CKD273 using 144 samples showed a sensitivity of 85% and specificity of 100% with an area under the curve (AUC) of 0.96 for the diagnosis of CKD. To establish an added value in patient management, CKD273 was assessed in several studies2-14. A graphic depiction of the studies published to date using CKD273 is presented in Figure 2.
Characteristics of CKD273 classifier:
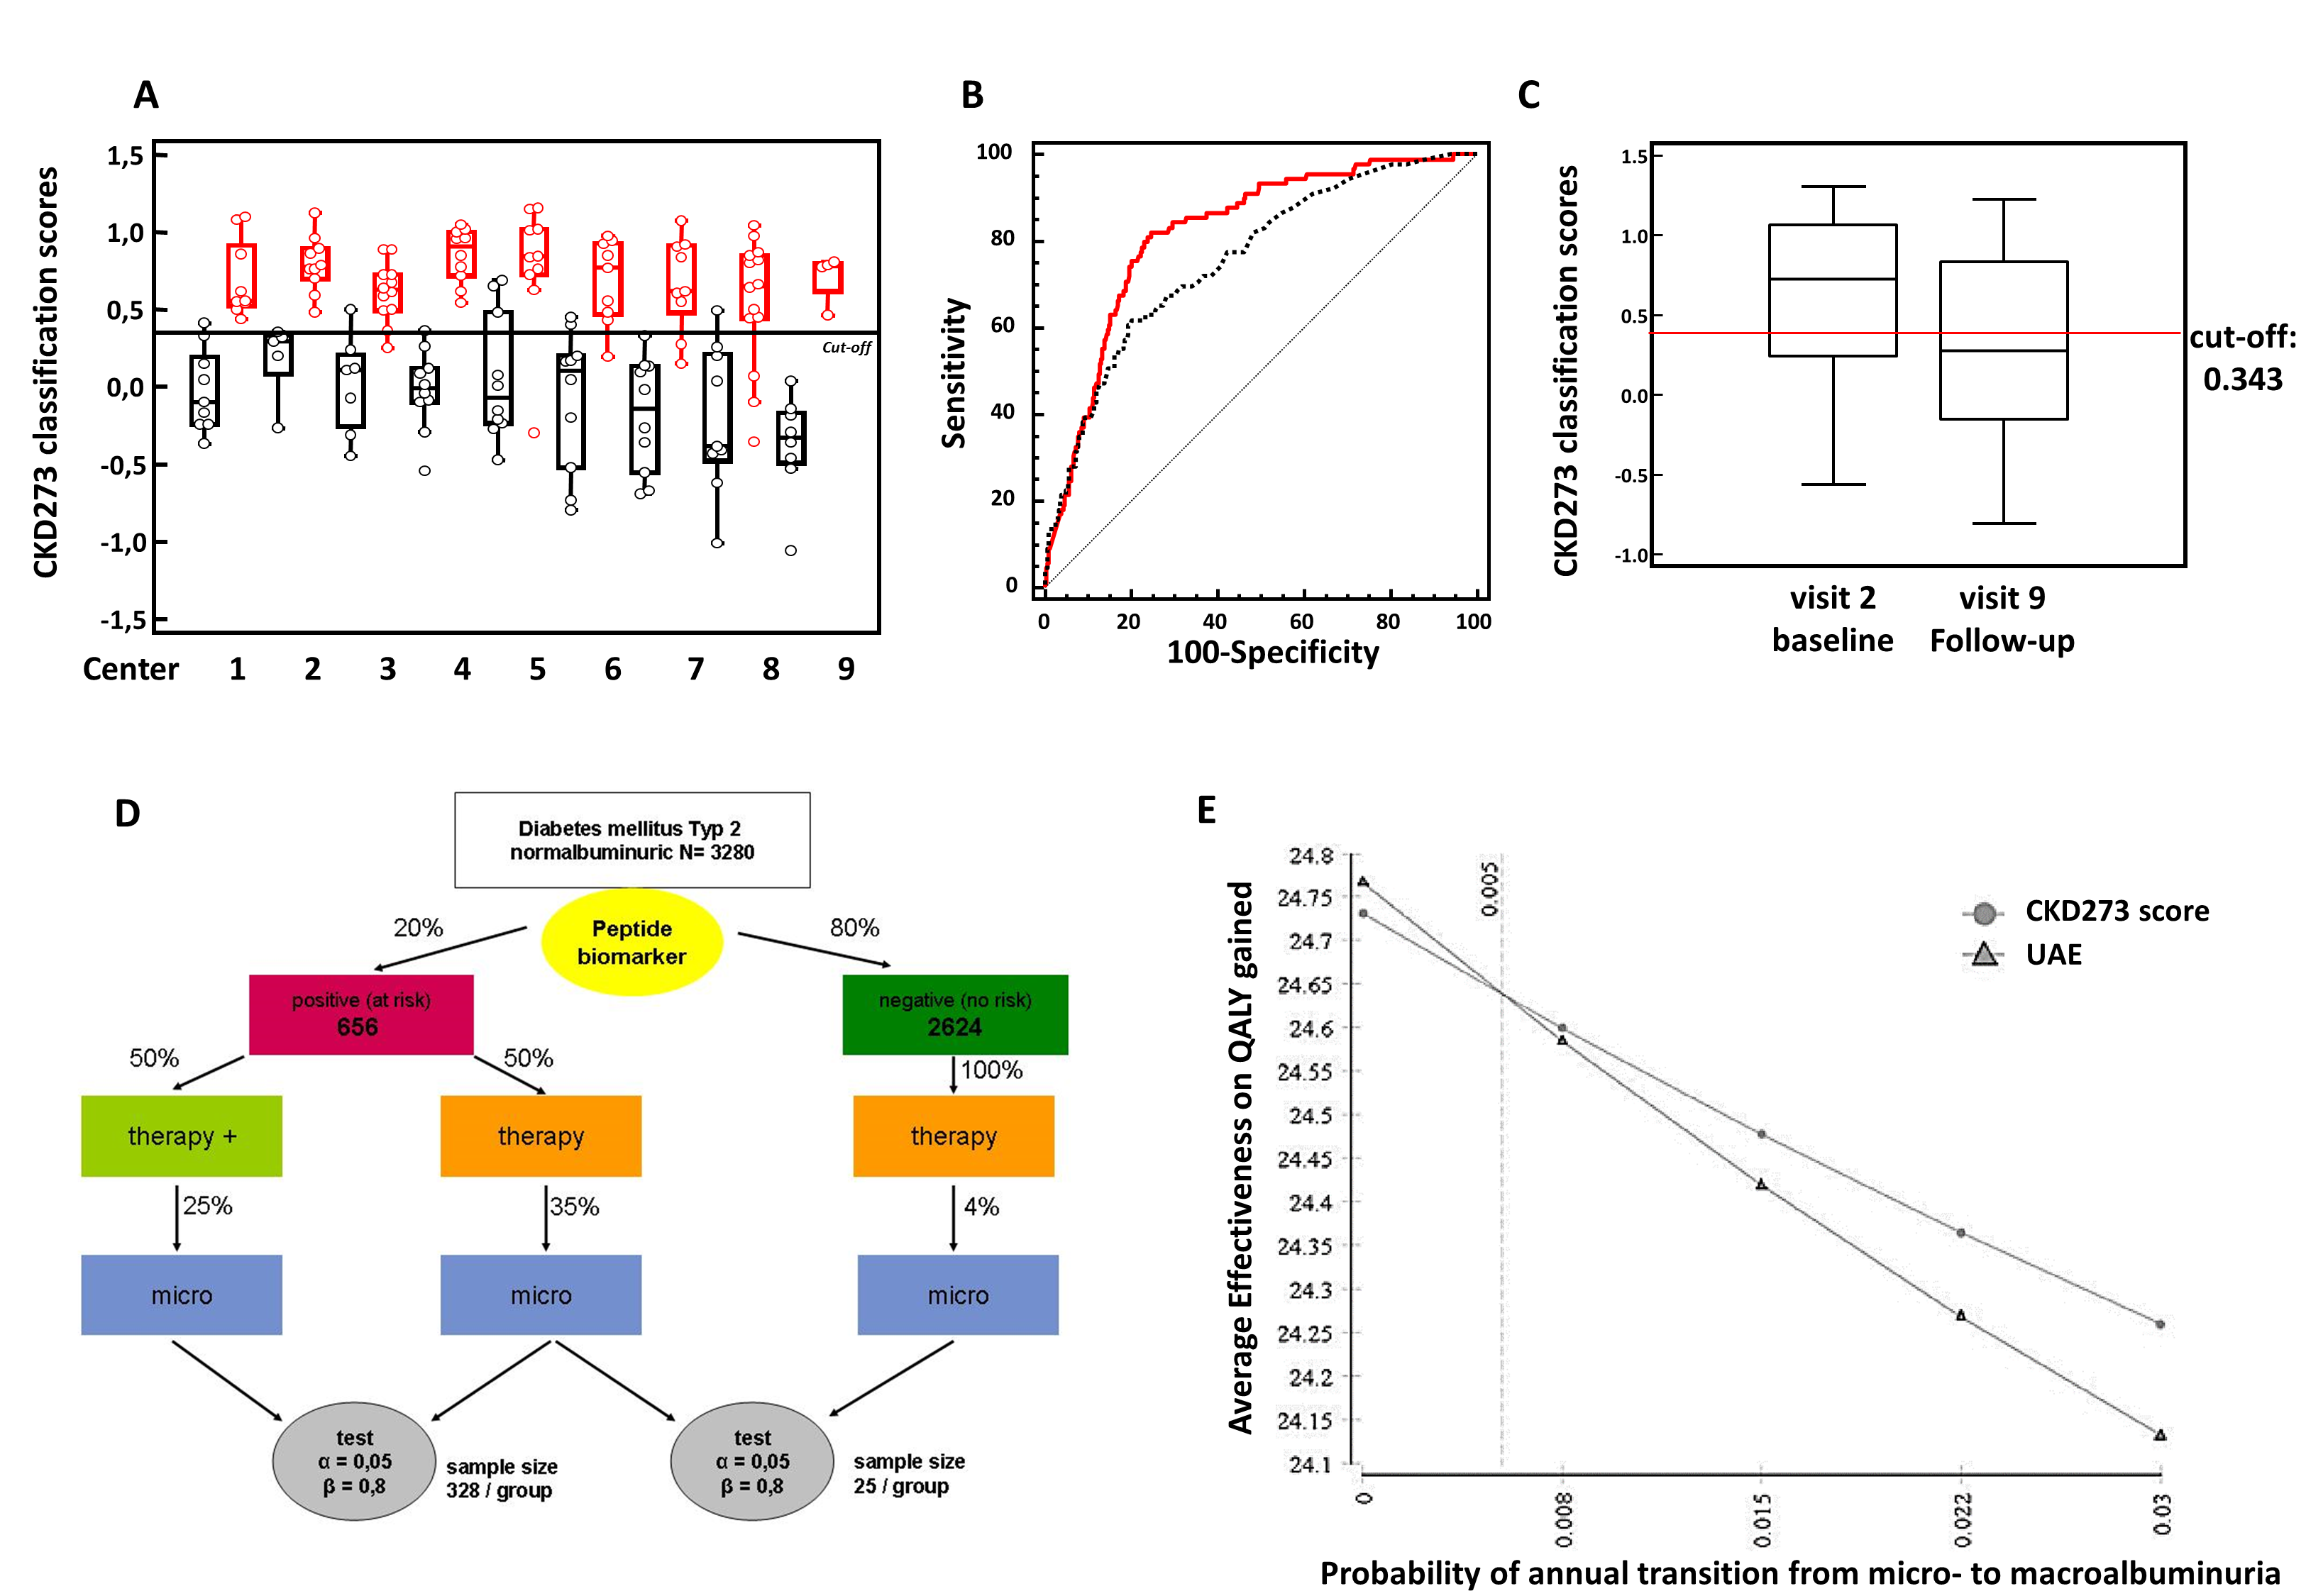
- is validated in independent multicentre cohorts1;7;13 (Figure 3A)
- is validated in longitudinal cohorts12;14
- shows better results than currently used biomarkers10;12;14 (Figure 3B)
- can predict endpoints of CKD3;10;11
- is validated concerning its stability, intra- and intermediate precision, reproducibility, and interference1;15
- shows treatment effects2;5;6 (Figure 3C)
- is used in an interventional trial (PRIORITY)16;17, (Figure 3D)
- is associated with mortality18
- attains high evidence levels19
- shows cost-effectiveness compared to urinary albumin excretion20 (Figure 3E)
- is used for pilot studies with pharmaceutical companies
- got “letter of support” from American Food and Drug Administration (FDA)
Non-invasive discrimination of various types of CKD
Currently, our CE-MS technology is capable of detecting over 80% of all CKDs using CKD273 classifier:
- Diabetic nephropathy (DN)
- Focal-segmental glomerulosclerosis (FSGS)
- IgA nephropathy (IgAN)
- Minimal-change disease (MCD)
- Vasculitis
- Lupus nephritis (LN)
- Membranous nephropathy (MN)
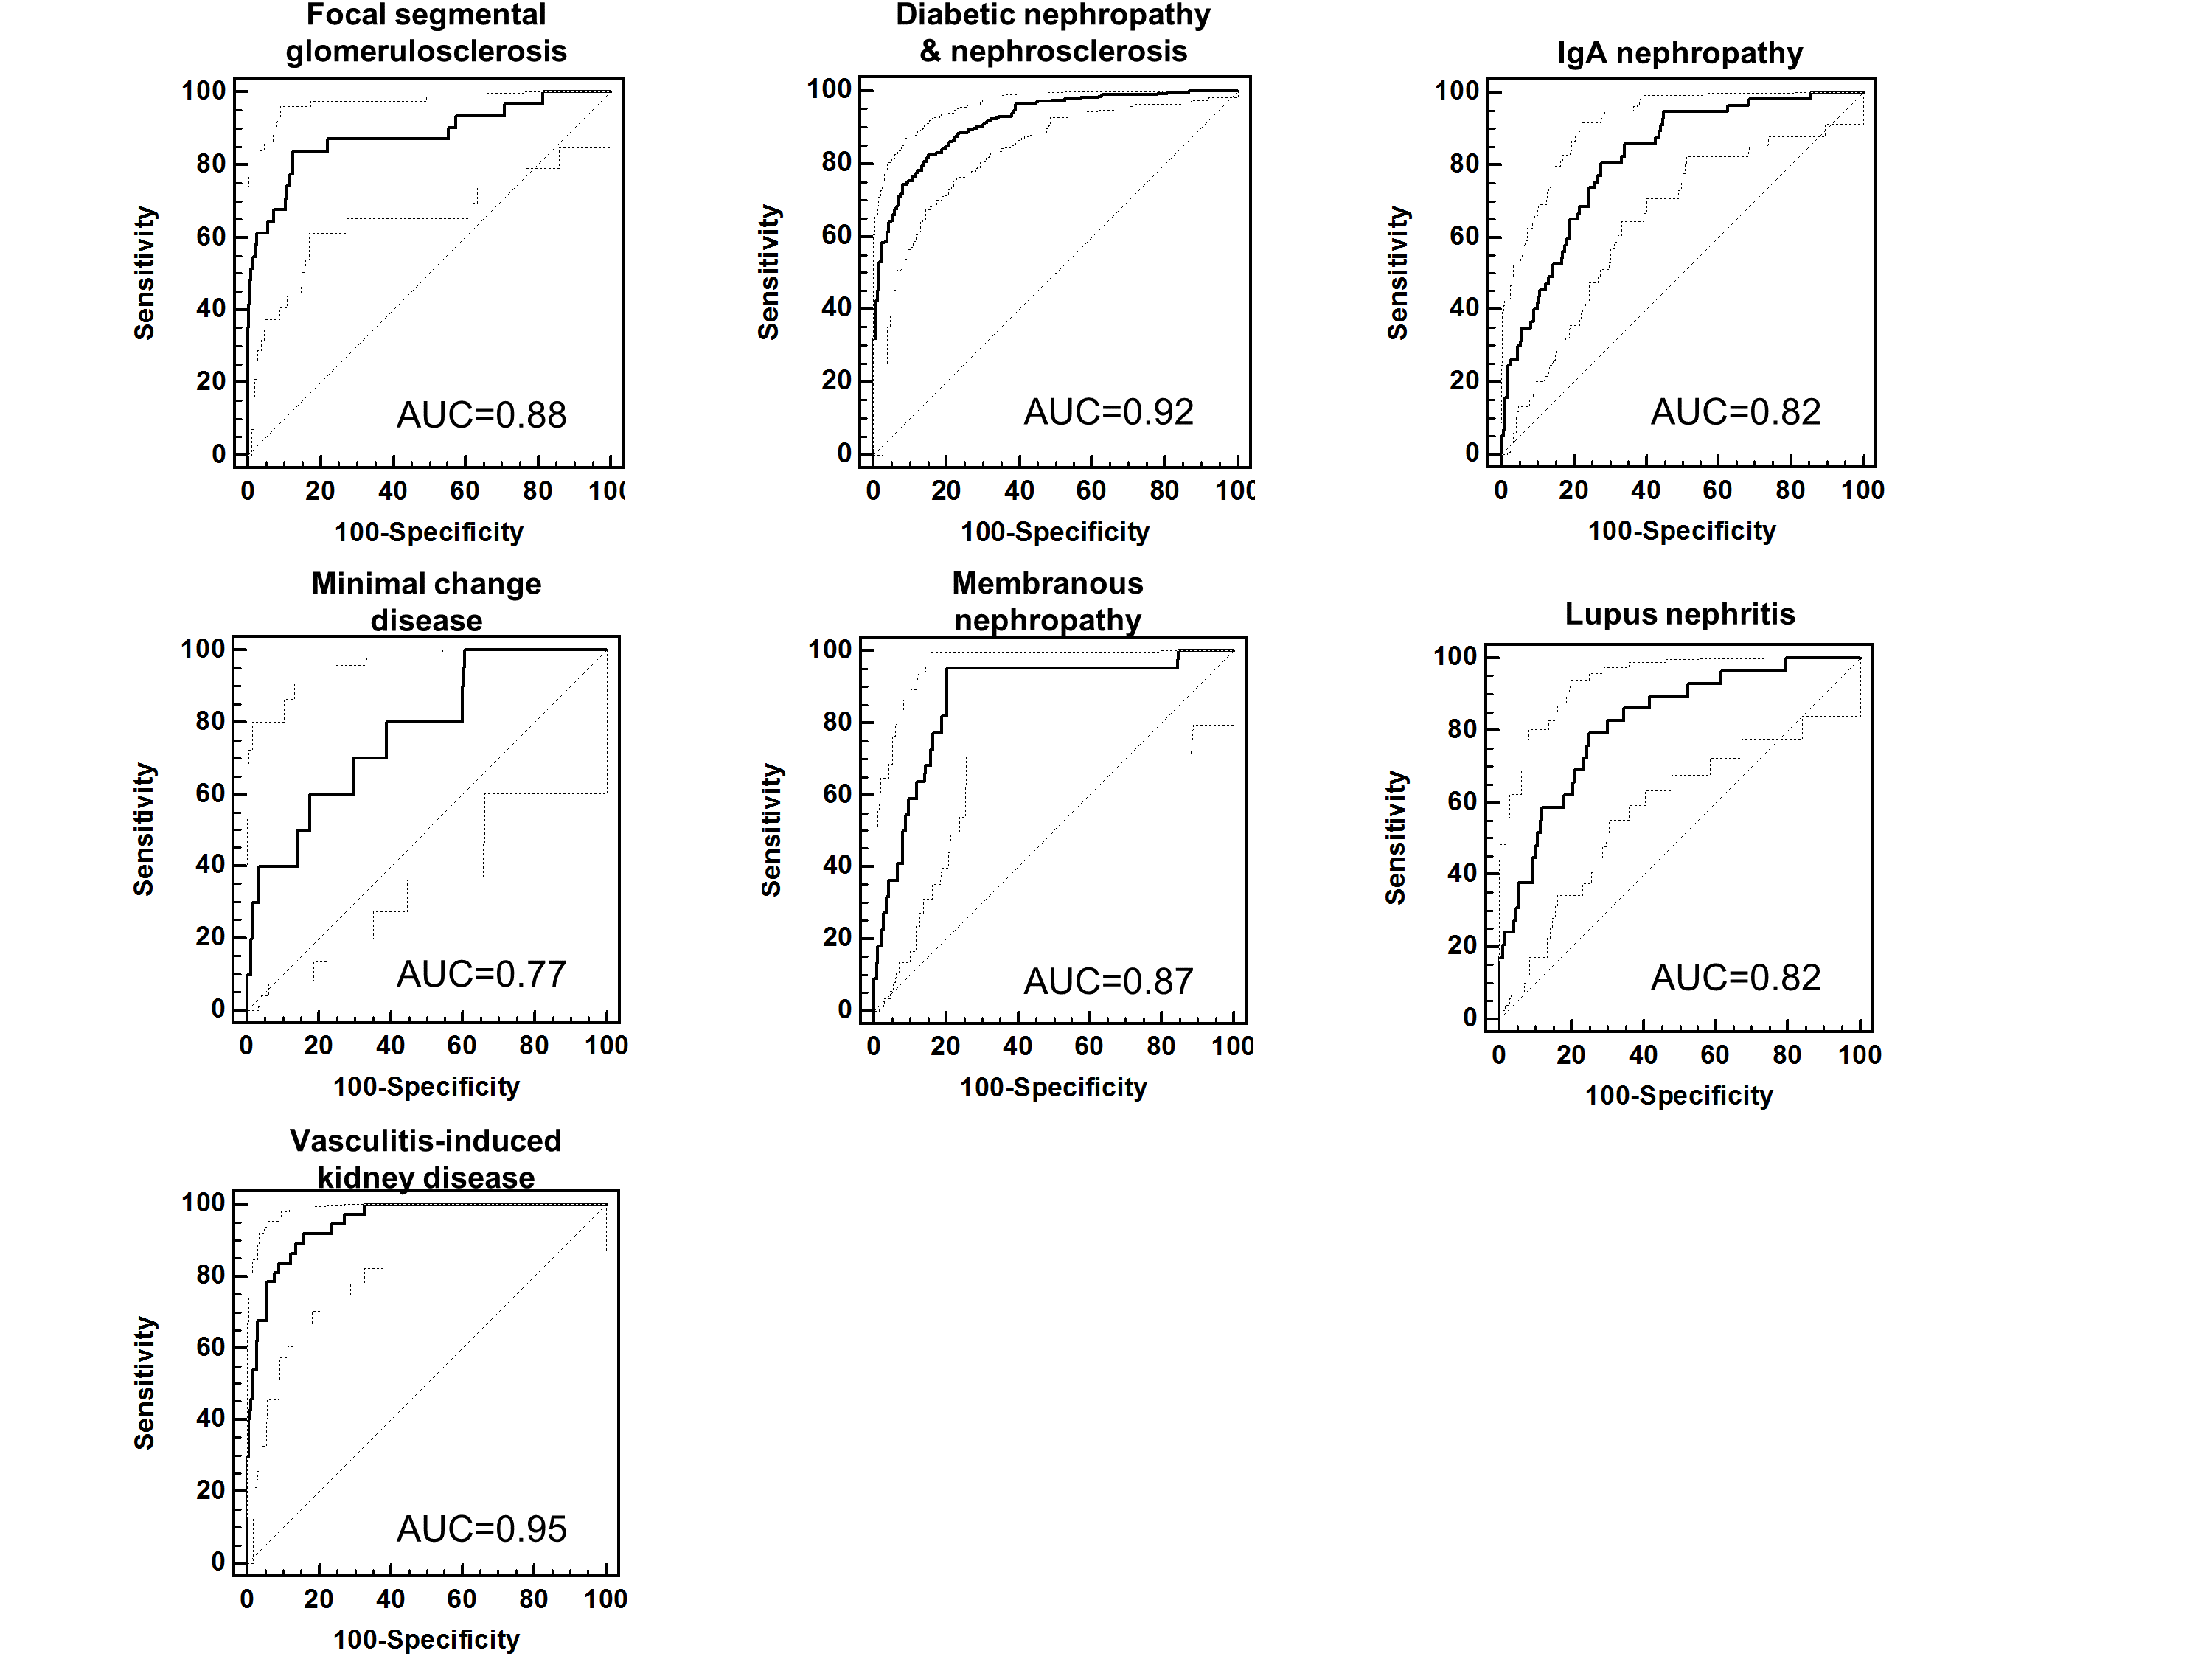
In addition, the urinary proteome analysis clearly differentiated various types of CKD. We could also define specific urinary peptide classifiers19 which are composites multiple peptides specific for a single CKD type. These classifiers enable a differential diagnosis of certain types of CKD (Figure 5). They may also serve as an excellent basis for the assessment of the different types of CKD, to understand molecular pathophysiology and to identify the best-suited therapeutic targets. In contrast to kidney biopsy, urinary proteome analysis offers the possibility of being applied early in the course of the disease when the benefit of intervention is optimal and of being repeatable without any risk for the patient and, thus, can be used to monitor progression of disease and/or treatment response.
For more information, please click on this link: The urine proteome and peptidome mirroring kidney health.pdf
REFERENCES:
- Good DM et al. Mol Cell Proteomics 2010; 9: 2424-2437
- Andersen S et al. BMC Nephrol. 2010; 11: 29
- Argiles A et al. PLoS One 2013; 8: e62837
- Gu YM et al. Nephrology Dialysis Transplantation 2014; 29: 2260-2268
- Lindhardt M et al. Nephrol Dial Transplant. 2016; 32(11): 1866-1873
- Lindhardt M et al. Nephrol Dial Transplant. 2018; 33(2): 296-303
- Molin L et al. J Proteomics 2012; 75: 5888-5897
- Ovrehus MA et al. Clin Proteomics 2015; 12(1): 21
- Pontillo C et al. Nephrol Dial Transplant. 2017; 32(9): 1510-1516
- Pontillo C et al. Kidney Int Rep. 2017; 2(6): 1066-1075
- Roscioni SS et al. Diabetologia 2012; 56: 259-267
- Schanstra JP et al. J Am Soc Nephrol. 2015; 26: 1999-2010
- Siwy J et al. Nephrol Dial Transplant. 2014; 29: 1563-1570
- Zürbig P et al. Diabetes 2012; 61: 3304-3313
- Mischak H et al. Clin Biochem 2013; 46: 432-443
- Lindhardt M et al. BMJ Open 2016; 6: e010310
- Tofte N et al. Diabet Med. 2018; 35(10): 1375-1382
- Currie GE et al. Cardiovasc Diabetol. 2018; 17(1): 50
- Critselis E et al. Nephrol Dial Transplant. 2014; 31: 249-254
- Critselis E et al. Nephrol Dial Transplant 2018; 33(3): 441-449
- Siwy J et al. Nephrol Dial Transplant 2017; 33(12): 2079-2089
- Rodríguez-Ortiz ME et al. Sci Rep. 2018;8(1): 15940
- Zürbig P et al. Diabetes Care. 2019;42(1): e4-e5
- Verbeke F et al. Nephrol Dial Transplant. 2021;36(5): 811-818
- Tofte N et al. Lancet Diabetes Endocrinol. 2020;8(4): 301-312
- Rudnicki M et al. Nephrol Dial Transplant. 2021;37(1): 42-52
- Catanese L et al. Proteomes. 2021;9(3): 32
- Mavrogeorgis E et al. Toxins (Basel) 2021;14(1): 10
- Peters B et al. Nephrol Dial Transplant 2023;38(12): 2826-2834
- Mavrogeorgis E et al. Nephrol Dial Transplant 2024;39(3): 453-462
__________________________________________________________________________________________________________________________________________________
Polycystic kidney disease
Polycystic kidney disease (PKD) is an inherited disorder characterised by cyst formation and enlargement primary in the kidney. PKD may impair kidney function and eventually cause kidney failure (Figure 1).
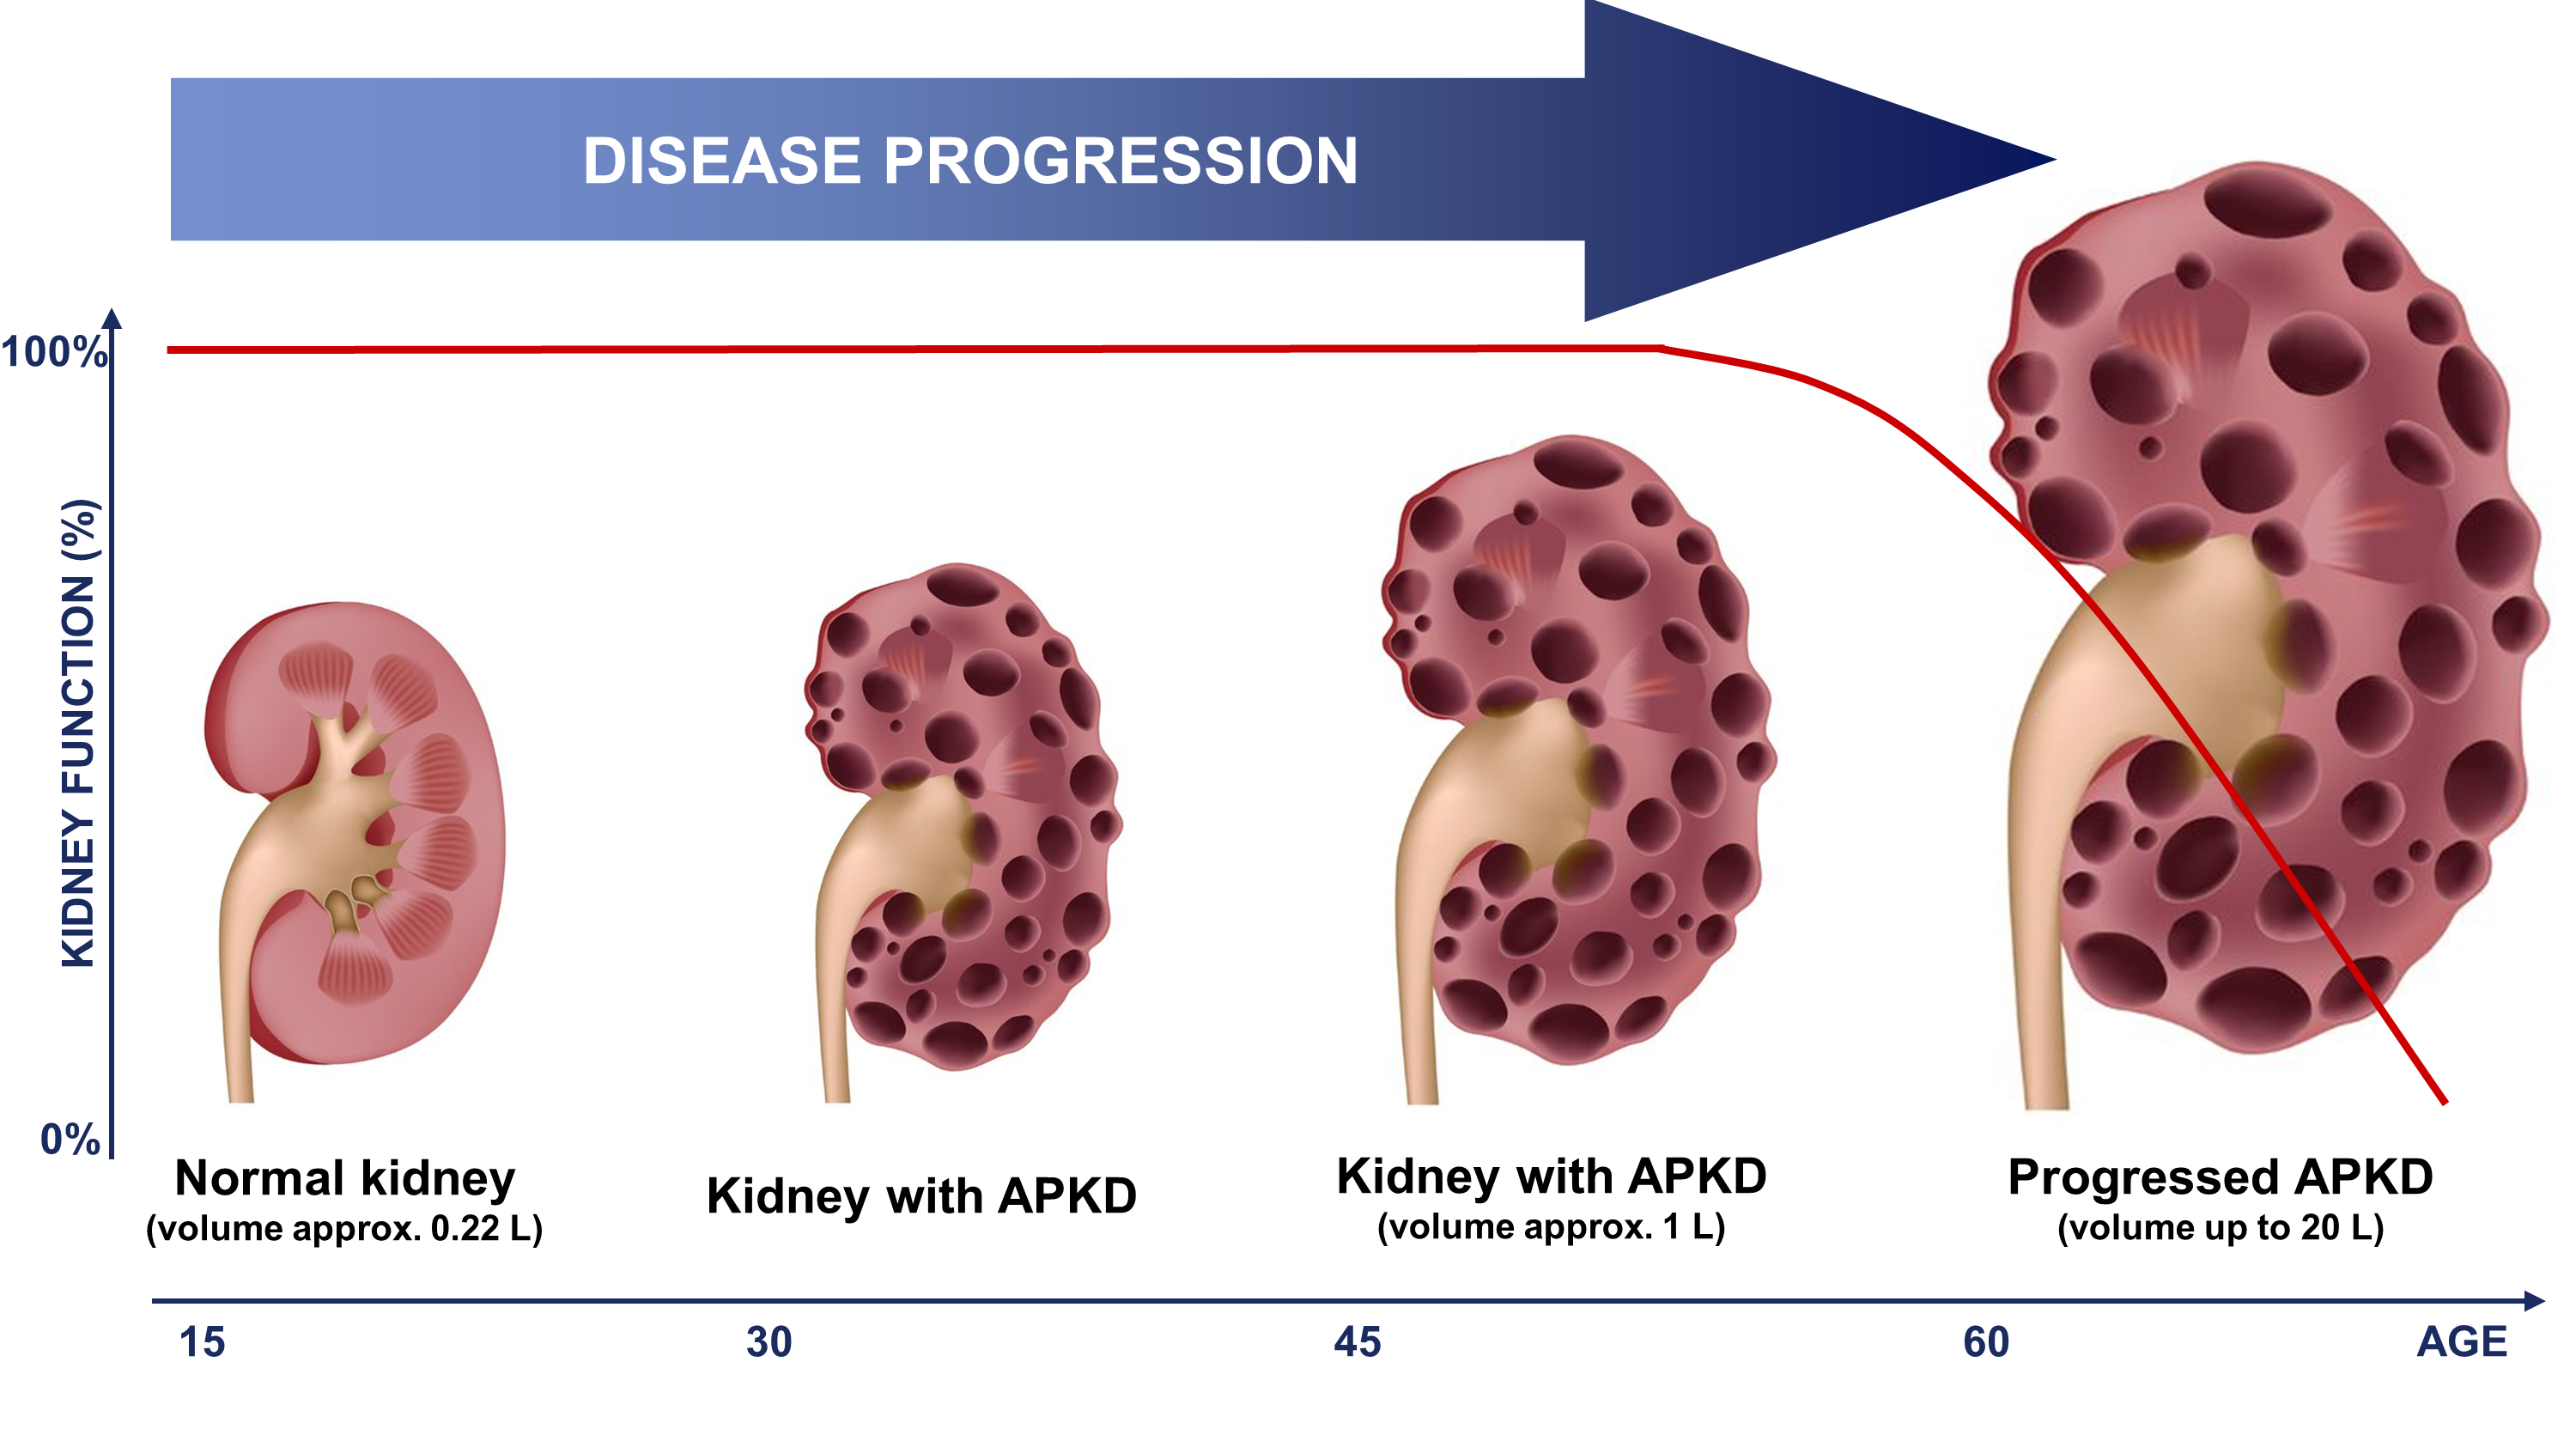
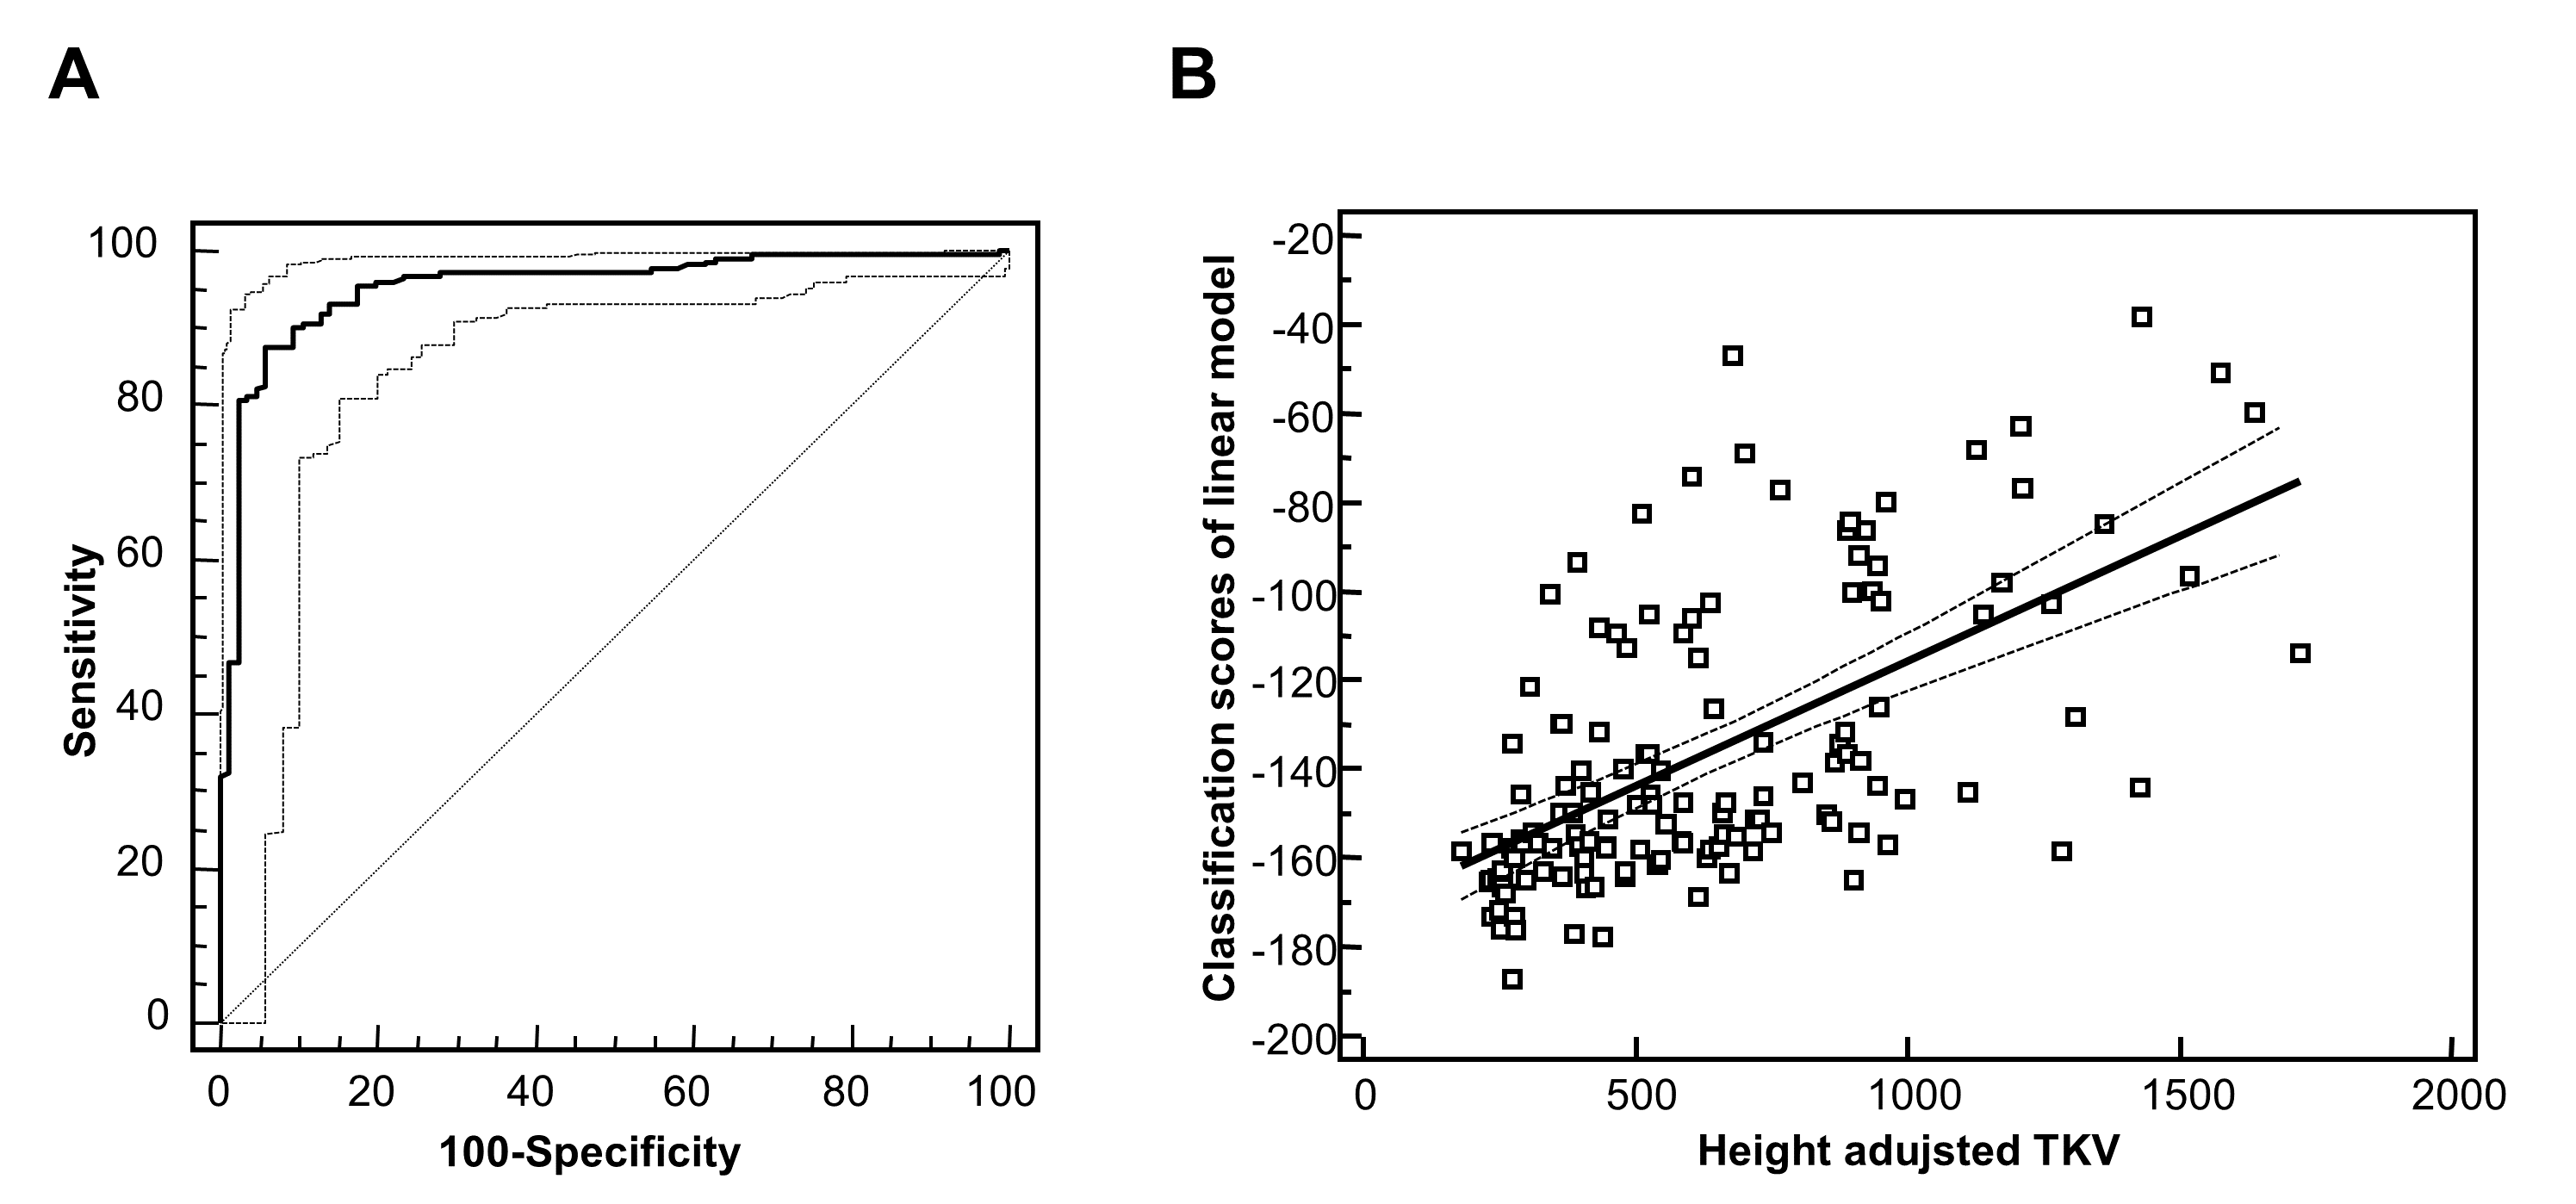
Autosomal dominant polycystic kidney disease (ADPKD) is the most common hereditary renal disease, with an incidence between 1:400 and 1:1000 live births. 2 and accounts for 7–10% of all patients requiring renal replacement therapy. Therefore, an early and high accurate diagnosis is needed. The diagnosis of ADPKD is usually based on the observation of kidney cysts by ultrasound in patients with positive family history for ADPKD. However, ultrasound imaging has limited sensitivity in children and young adults, before the age of 30 years. Furthermore molecular diagnosis by genetic testing has been hampered by the genetic complexity of ADPKD, and only 65% of ADPKD patients exhibit definitive pathogenic (i.e. truncating) mutations. On the other hand, the biopsy in human ADPKD with preserved kidney function is contraindicated, because renal tissue is rarely available. Proteomic analysis of urine offers a non-invasive means to simultaneously detect changes in the expression and processing of multiple proteins. The urinary peptide based classifier shows high diagnostics accuracy (Figure 2A) and also a correlation (Figure 2B) to the height adjusted total kidney volume (htTKV)1;2 that has been considered the best prognostic marker in ADPKD. However, accurate determination of htTKV is time-consuming, requires quantitative imaging algorithms and is not universally accessible. In addition, monitoring response to therapy by TKV requires relatively long follow-up times to allow for accurate determination of TKV changes over time.
Moreover, urinary peptidomic biomarkers reliably predict progression to end stage renal disease (ESRD) in ADPKD patients based on a single baseline urine sample 3. The urinary peptide based classifier allows stratification of ADPKD patients according to their risk to develop ESRD within the next 10–13 years (Figure 3).
REFERECES
- Kistler AD et al. Kidney Int 2009; 76: 89-96
- Kistler AD et al. PLoS One 2013; 8: e53016
- Pejchinovski M et al. Nephrology Dialysis Transplantation 2016; 31: 22
- Liu Y et al. Sci Rep. 2018; 8(1): 5584